
MyFleet is a cloud-based solution that provides real-time fleet management and voyage planning for commercial shipping and cruise operators. The software integrates with ECDIS systems, allowing users to access and share information in real-time. The main purpose of MyFleet is to perform the vessel’s due diligence for the voyage plan, from the safety and voyage performance perspectives. MyFleet shows the various vessels’ routes and voyage plans: planned, executed and monitored in ECDIS for the current voyage. It also provides insight on the safety-related environment, an environment that takes into account navigational data, the current route, weather, and digital data used on the vessel being monitored.
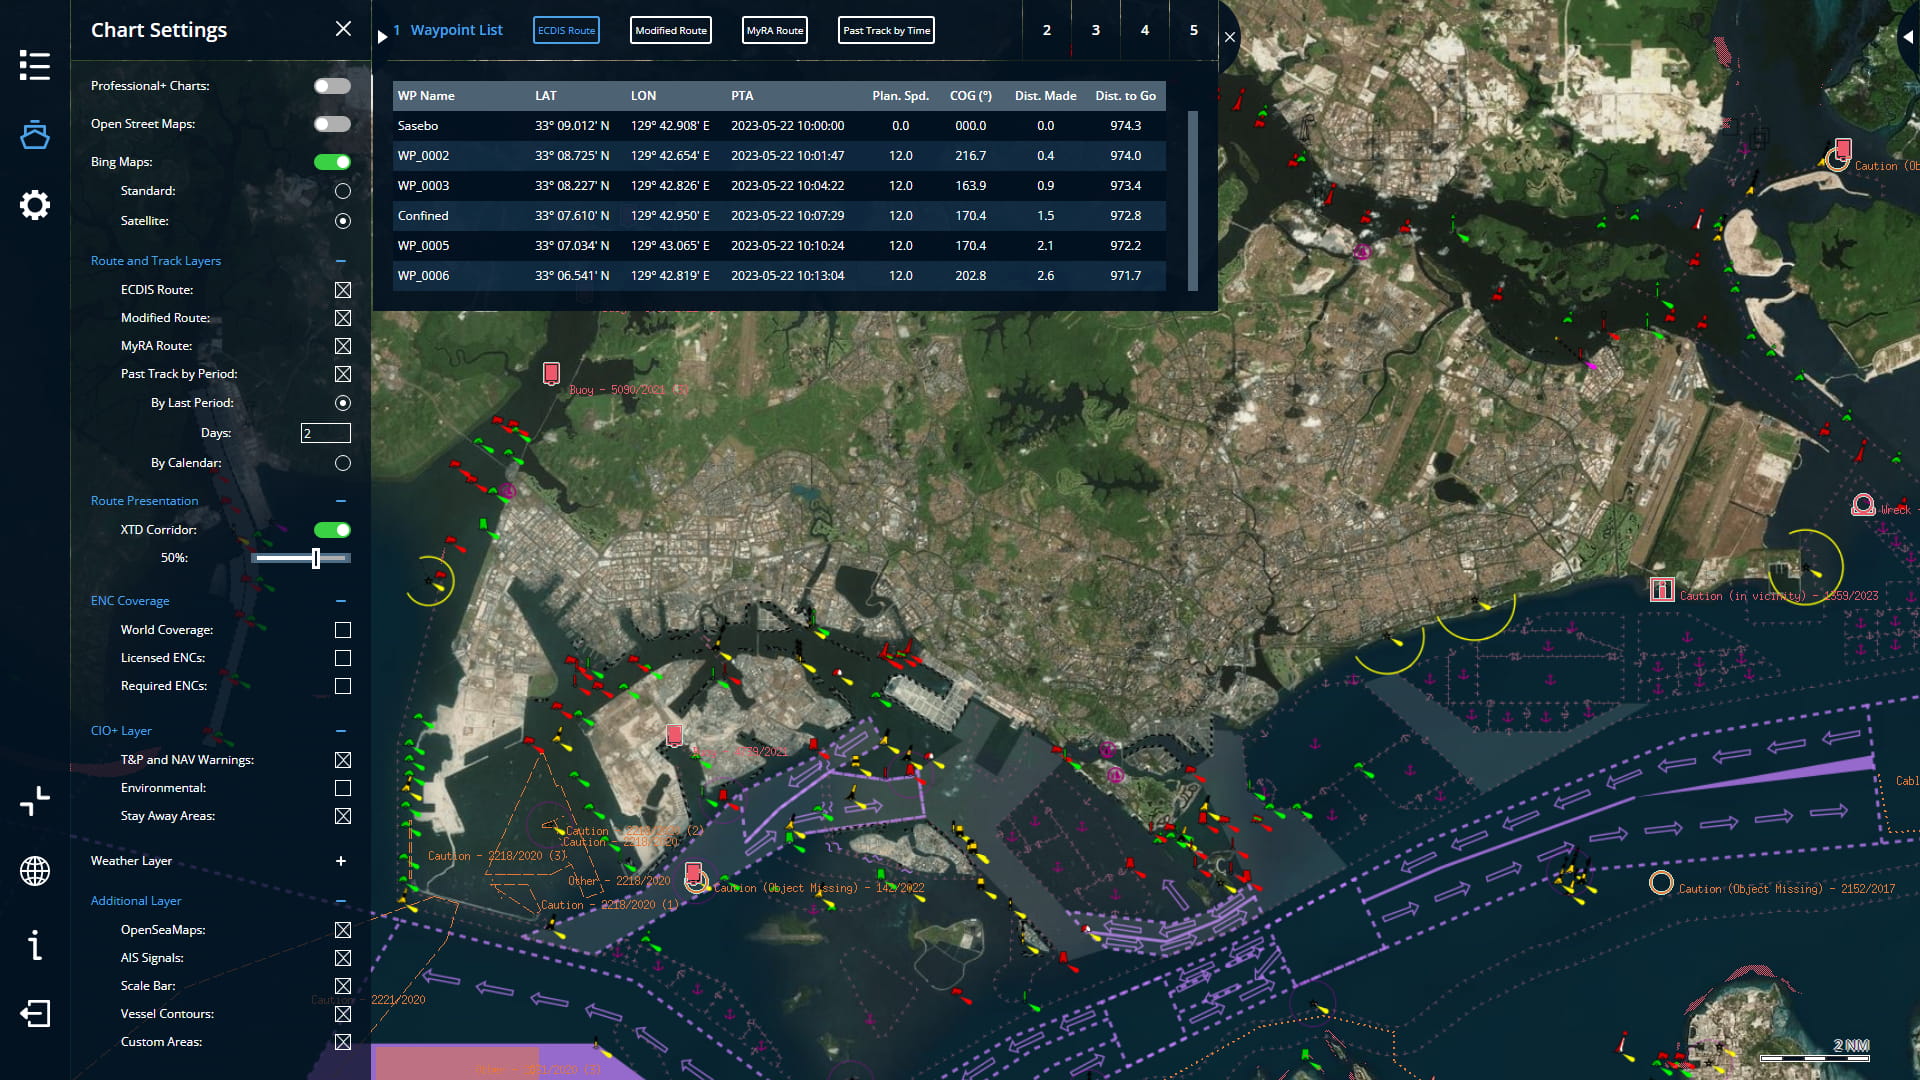
The monitoring function is provided by overlaying a variety of information on the electronic chart in the web environment (Web Map Service). The mariner using MyFleet can select and filter the information that he/she would like to see; this is in addition to configuring a monitored fleet, by selecting vessels that are to be monitored.
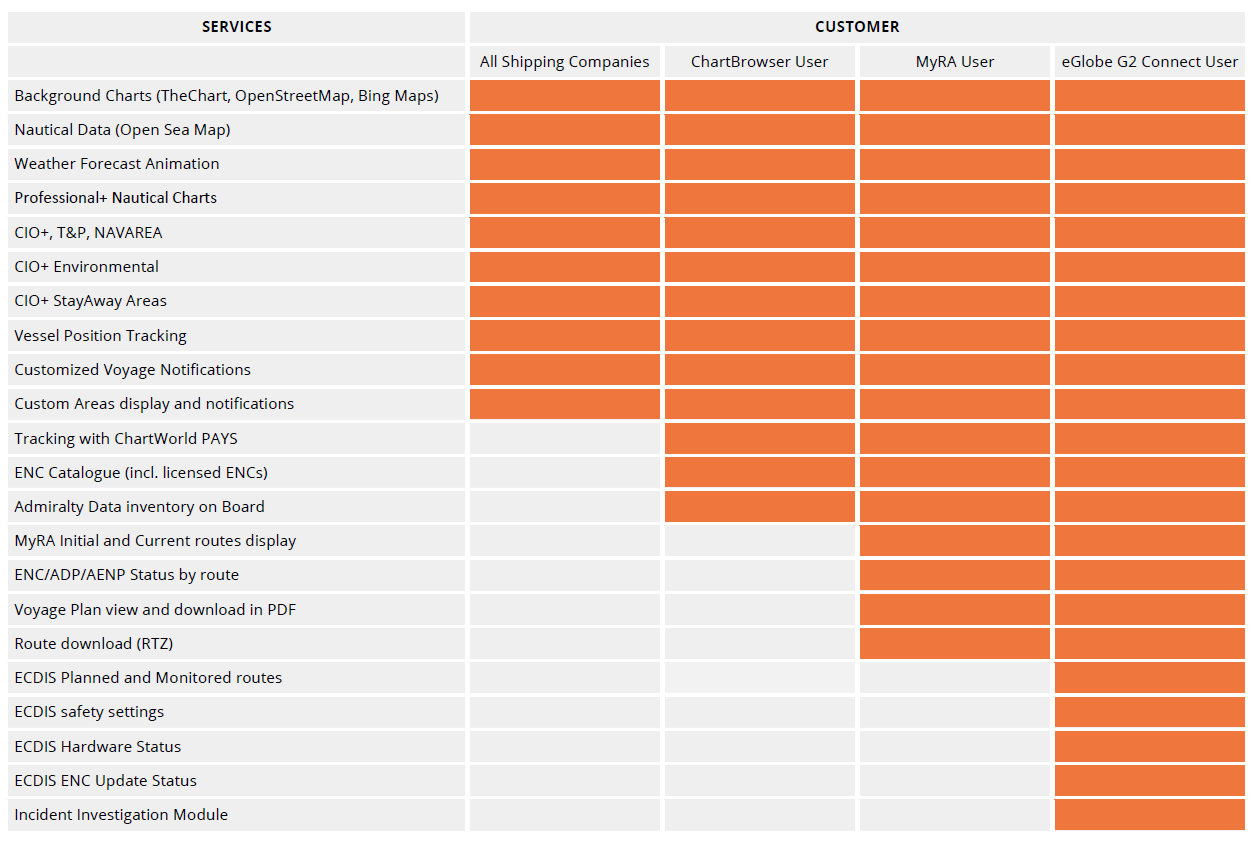
| Background charts | Online chart display: TheChart, Open StreetMaps, Bing Maps | |
| Overlay nautical data | Open Sea Maps – freely usable nautical information and geospatial data compiling a worldwide nautical chart. | |
| Overlay weather forecast | Weather forecasts from www.windy.com | |
| Overlay ENC boundaries | Electronic catalogue of ENC with a selection of licensed charts of the selected vessel or charts required for a voyage. | |
| Vessel status | Selection of the vessels for compiling own fleets. Vessel particulars and voyage status. | |
| Planned route and voyage plan | Graphical display of the latest planned route. The download of a printable voyage plan, rtz and t&p file | |
| Indications and notifications | Configurable safety indications if the vessel approaches or enters a specific area. Notifications related to the voyage events and digital data delivery. | |
| CMAP subscription for MyFleet * | Worldwide coverage of i4-Insight (Lloyd’s Register) Professional+ charts provided via hosted web map service | |
| CIO t&p + NAVAREA subscription for MyFleet * | Global coverage of T&P notices and NAVAREA warnings provided as a chart overlay. | |
| CIO+ Environmental subscription for MyFleet * | Global coverage of zones with environmental restrictions: ECA areas, EU port areas, US Marine sanctuaries, VGP areas, 24 NM Zones | |
| CIO+ StayAway bathymetric chart overlay | Shows hidden shoals, or shallow hazards derived from satellite images. Covering areas with CATZOC worse than A2. | |
| Custom Areas overlay | Customer-defined areas on top of the displayed nautical information. | |
| Monitor vessel position | Plotting of position of the monitored vessel obtained from AIS data. Integration of the shipping company own position report source. | |
| Incident Investigation Module (IIM) | Daily recorded replay files from the on-board eGlobe G2 ECDIS Connect. | |
| Office eGlobe G2 Service | A version of eGlobe G2 ECDIS software delivered and installed on a company’s computer. |
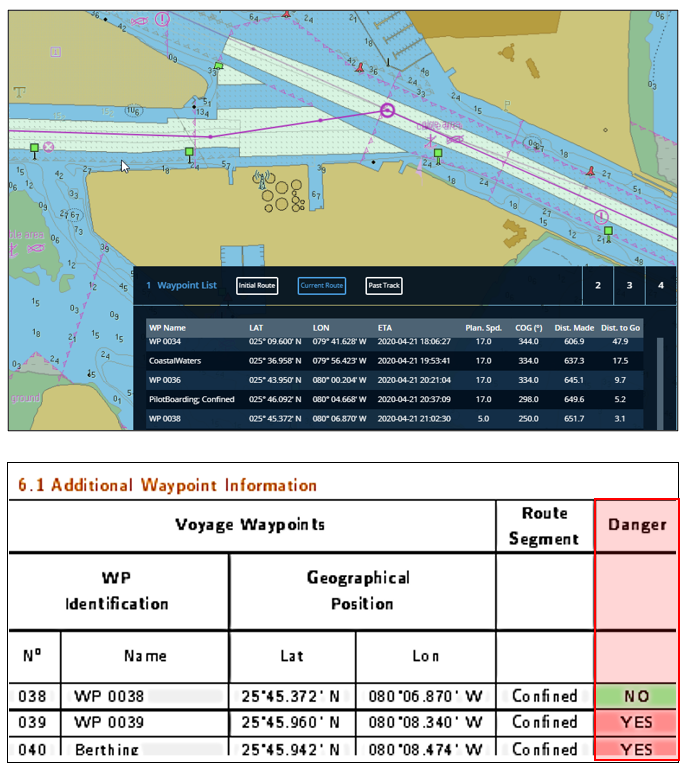
1. Select the vessel you want to examine.
2. Open the “current” or latest modified voyage plan
3. Check entry to the voyage plan
4. Route check results – focus on the WPs highlighted as a danger
5. Visually check and verify the safety of the highlighted WPs
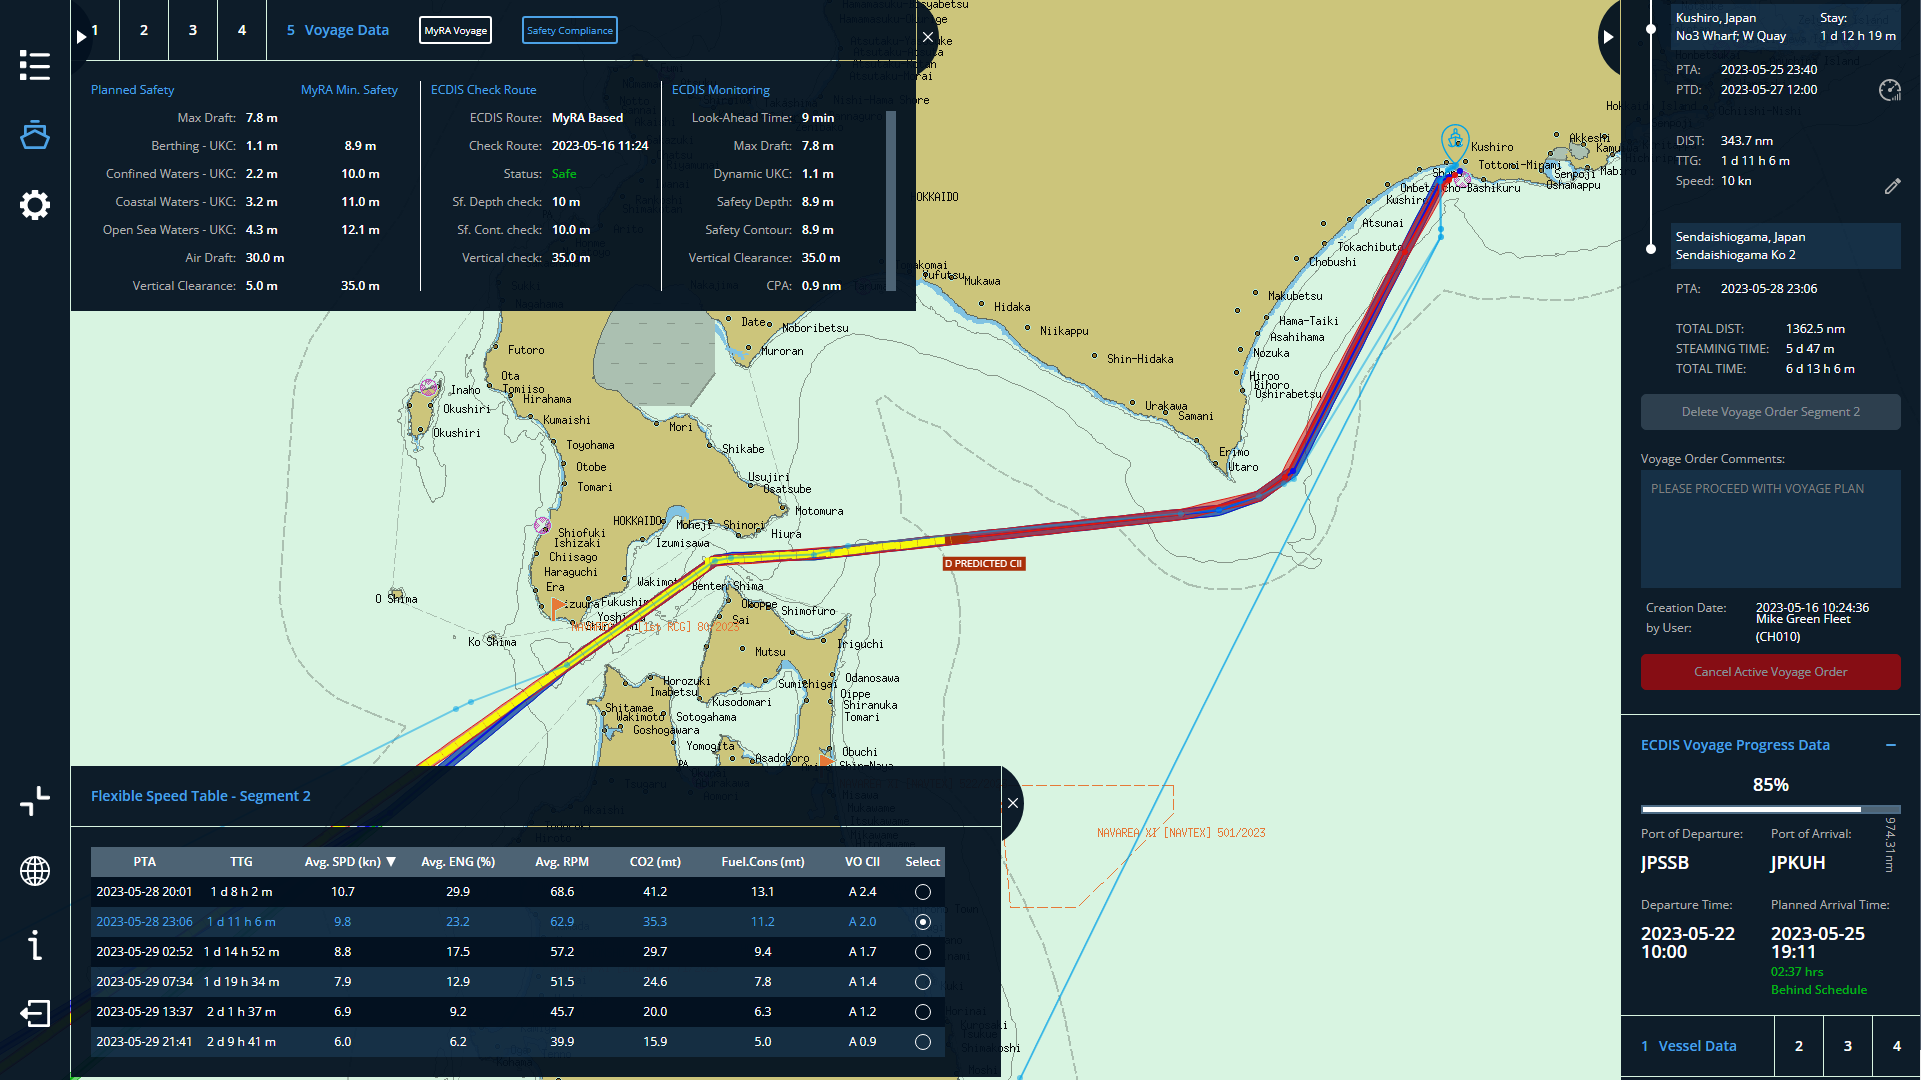
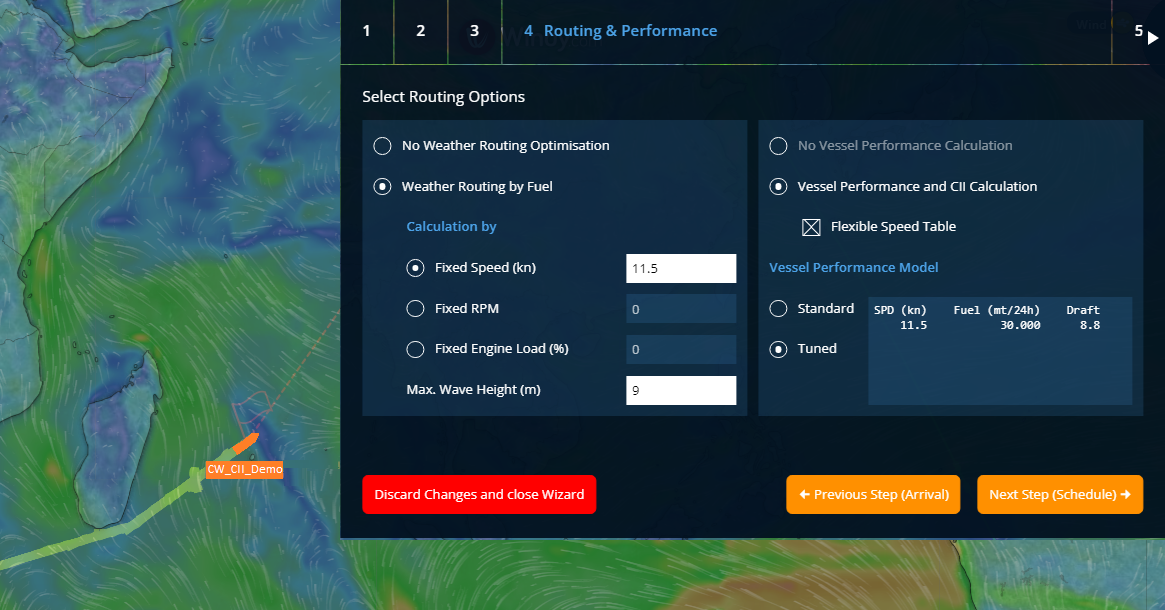
The automated voyage calculation is based on the single or two voyage segments, - in the case of the Laycan voyage leg from the current vessel position to the port of loading, and then for the Laden voyage leg to the port of destination. An approved Voyage Order is delivered to the onboard MyRA Ship Voyage Planning tool, with immediate notification to the vessel or Captain’s e-mail address.
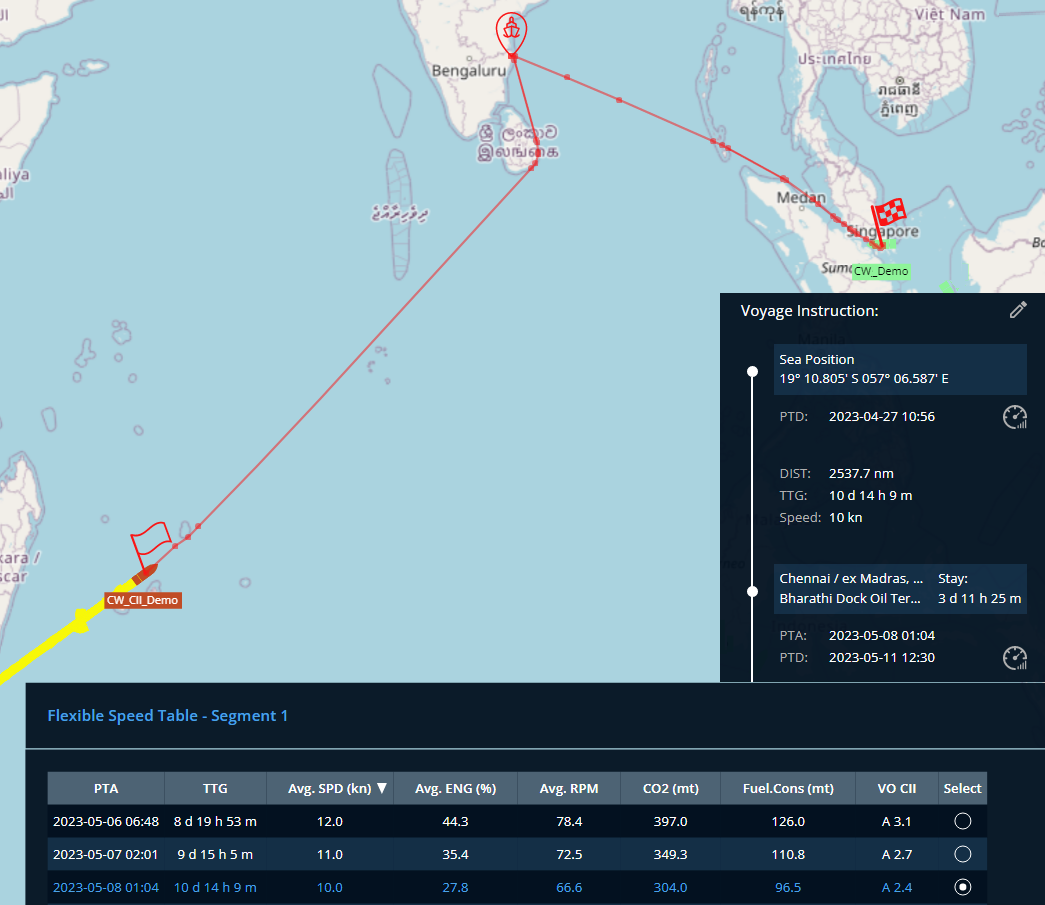
MyFleet includes Weather Routing: this enables the Voyage Order route to be created and calculated using different options, such as fixed speed, fixed RPM, fixed engine load, and weather limits. The Voyage Order with Weather Routing, Vessel Performance and CII Predictions enable bridge and onshore teams to make better decisions and improve the efficiency of their operations.
ChartWorld's digital solutions are used by world's leading shipping companies and cruise operators, to improve safety, compliance, efficiency, and emissions reporting.
For further product information please contact the ChartWorld sales team using the online contact form.